In the vast expanse of the digital landscape, where trends shift at the speed of a swipe and content reigns supreme, YouTube stands as a titan of influence. For creators and brands alike, understanding the metrics that drive engagement is not just an option—it’s a necessity. Enter YouTube Analytics: a treasure trove of data that, when interpreted correctly, holds the key to unlocking the full potential of your content. In this article, we’ll embark on a journey into the intricacies of YouTube’s analytical tools, demystifying the numbers and trends that can enhance influencer strategies. Whether you’re a seasoned content creator looking to refine your approach or a curious newcomer eager to make your mark, decoding these analytics will empower you to craft targeted, impactful strategies that resonate with audiences and elevate your online presence. Join us as we explore how to transform raw data into actionable insights, paving the way for sustainable growth and deeper connections in the ever-evolving world of influence.
understanding Key Metrics to Measure Success
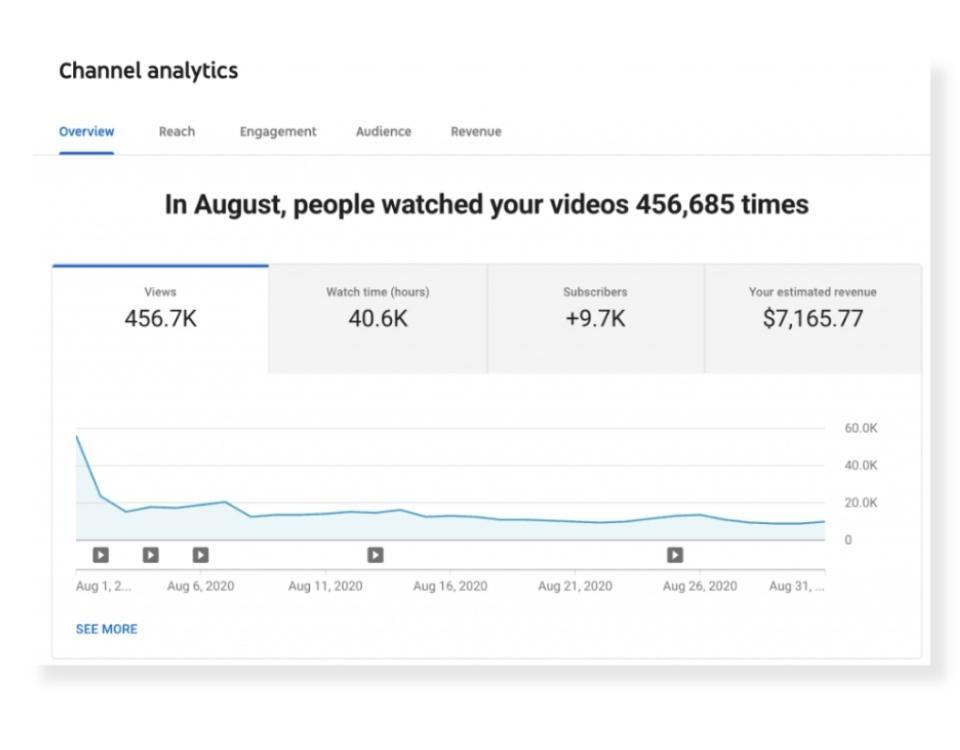
To effectively gauge your performance on YouTube, it’s essential to focus on several key metrics that can illuminate the path to success. These metrics not only provide insights into audience engagement and growth but also help fine-tune your content strategy.Some of the most critical metrics include:
- Watch Time: Indicates how long viewers stay engaged with your content, a crucial factor in ranking your videos.
- Audience Retention: Shows the percentage of the video watched by viewers, helping identify which parts of your content are most compelling.
- Click-Through Rate (CTR): Measures the effectiveness of your thumbnails and titles in driving traffic to your videos.
- Subscriber Change: Tracks the number of subscribers gained or lost after each video, providing insight into the impact of your content on audience loyalty.
Utilizing these metrics enables influencers to make data-driven decisions that enhance their strategies. for instance,evaluating traffic sources helps determine where your views are coming from,whether it’s direct searches,suggested videos,or social media. Analyzing demographics, such as age and location, allows for tailoring content that resonates with your audience. A simplified overview of critical metrics can be summarized in the following table:
| Metric |
Description |
Importance |
| Watch Time |
Total minutes viewed across videos |
Enhances video ranking |
| Audience Retention |
Percentage of the video watched |
Indicates engaging content |
| CTR |
Percentage of clicks on video thumbnails |
Assess title and thumbnail effectiveness |
| Subscriber Change |
Gains/losses per video |
Measures audience loyalty |
Navigating Audience Insights for Tailored Content Strategies
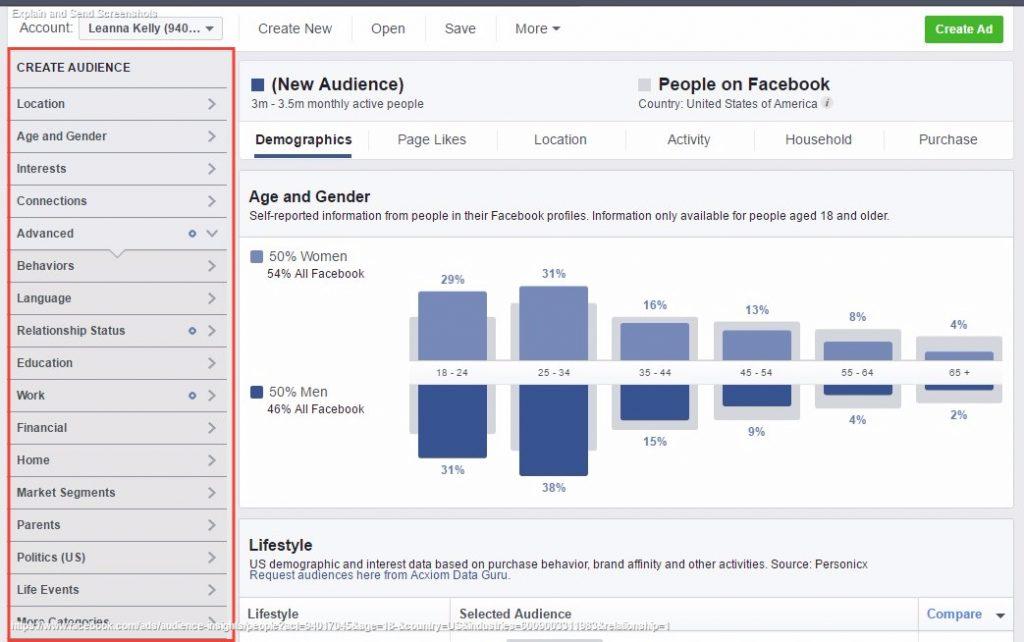
Understanding your audience is the cornerstone of crafting effective content strategies. By diving deep into YouTube Analytics, influencers can unearth valuable insights that reveal who their viewers are, how they engage with content, and what resonates with them. Consider exploring metrics such as:
- Demographics: Age, gender, and geographic location of your audience.
- Watch Time: The total minutes watched,giving insight into viewer engagement.
- Top Traffic Sources: Where viewers are finding your videos, such as search, suggested videos, or external links.
With this data at your fingertips,tailoring content becomes a strategic endeavor. By identifying patterns in viewer interaction, influencers can develop targeted approaches that cater explicitly to audience preferences. Implementing A/B testing on titles, thumbnails, and formats can yield further insights into audience behavior.For a structured approach, consider the following table to track content performance:
| Content Type | Engagement Rate | Audience Retention |
| Vlogs | 7.5% | 65% |
| Tutorials | 9.2% | 70% |
| Product Reviews | 6.8% | 60% |
Leveraging Engagement Data to Enhance Interaction
Understanding engagement metrics is key for influencers looking to fine-tune their strategies and foster genuine connections with their audience. By analyzing parameters such as watch time, likes, comments, and shares, creators can identify which content resonates most effectively. this data can guide them in crafting rich, engaging videos that capture viewer interest, ensuring that every upload aligns with audience preferences. Analyzing trends over time reveals shifts in viewer behavior, allowing influencers to adapt their content to maintain relevance and boost interaction.
Moreover,segmentation of audience analytics provides deeper insights into demographic engagement patterns. Knowing details such as age, location, and viewing habits allows influencers to personalize their messaging. As a notable example:
| Demographic Group |
Common Interests |
Preferred Content Format |
| 18-24 years |
trends, Fashion, Gaming |
Short-form, Interactive |
| 25-34 years |
Fitness, Cooking, Travel |
How-to, Vlogs |
| 35+ years |
Finance, Home Décor, Lifestyle |
Long-form, Reviews |
This precise targeting empowers influencers to cultivate their brand identity, enhance viewer satisfaction, and ultimately, drive collaborative opportunities. Adopting a data-driven mindset inspires more focused content creation, transforming routine uploads into strategic ventures that deepen interaction and loyalty across viewer demographics.
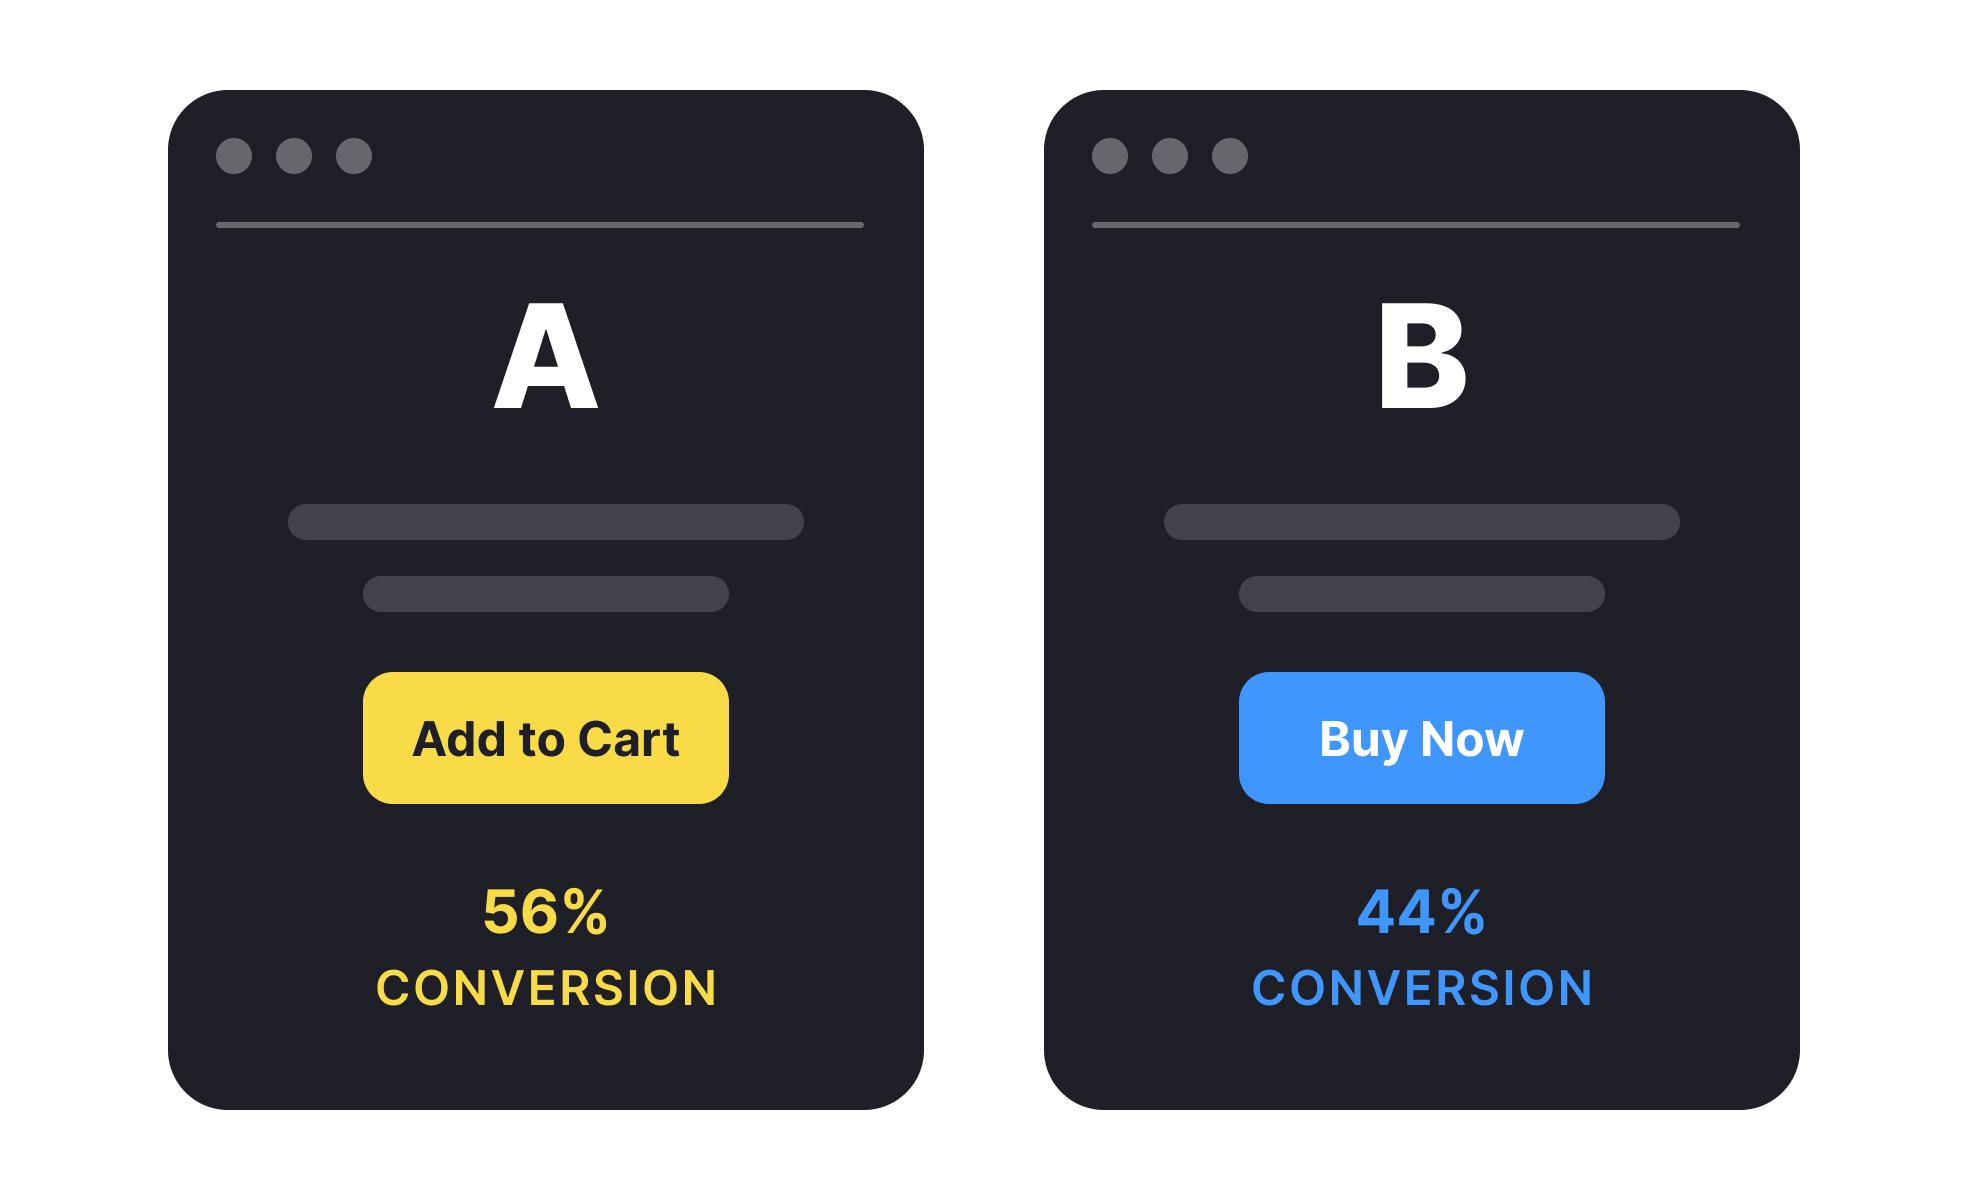
To effectively enhance video performance, employing A/B testing techniques allows creators to optimize key elements systematically. Testing different thumbnails, for instance, can significantly impact click-through rates, allowing influencers to discover which visuals engage their audience best.Similarly, experimenting with varied video lengths can reveal whether viewers prefer bite-sized content or longer, in-depth presentations. This iterative process enables influencers to make data-backed decisions to tailor their content to meet audience preferences.
The insights gained from A/B testing should not only focus on visual aspects but also cover title variations and description formats. By analyzing performance metrics such as average watch time and engagement rates, influencers can refine their messaging for maximum effect. Consider creating a simple comparison table to summarize the test results:
| Test Element | Variation A | Variation B | Result Analysis |
| Thumbnail | Radiant Colors | muted Colors | +15% Click-Through Rate |
| Video Length | Short (5 min) | Long (15 min) | +20% Engagement |
| Title | How to Boost Views | Increase Your Reach Today! | +10% Views |
Concluding Remarks
In the ever-evolving landscape of digital content, understanding the nuances of YouTube Analytics is no longer a luxury but a necessity for influencers looking to enhance their strategies. By delving into the depths of viewer behavior, demographics, and engagement metrics, creators can not only refine their content but also cultivate a more genuine connection with their audience. As we’ve explored throughout this article, the power of data lies not just in numbers but in the stories those numbers tell—stories that reveal the heartbeats of communities eager for authentic engagement.
As you venture forward, remember that every view carries insight, every subscriber tells a story, and every piece of feedback is an chance for growth. Armed with this knowledge, you can craft compelling narratives that resonate and inspire, ensuring your influence not only thrives but evolves alongside the ever-changing rhythms of YouTube. So, harness the power of analytics, unlock the potential of your platform, and watch as your influence transforms into a force for creativity and connection. The journey is ongoing, and the possibilities are limitless.