In the vast digital expanse where creativity meets commerce, YouTube has emerged as a powerful platform for influencers seeking to carve their niche in the crowded online landscape. With millions of channels vying for attention, understanding what makes content resonate is more essential than ever. Enter YouTube Analytics—a treasure trove of data that offers a behind-the-scenes glimpse into audience behavior, engagement patterns, and content performance. This article aims to unravel the complexities of these analytics, providing influencers with the insights needed to navigate the platform effectively. Whether you’re an aspiring creator or a seasoned icon, decoding YouTube Analytics can be the key to unlocking your channel’s potential and cultivating a loyal following. Join us as we explore the metrics that matter and the strategies to transform raw data into actionable steps toward influencer success.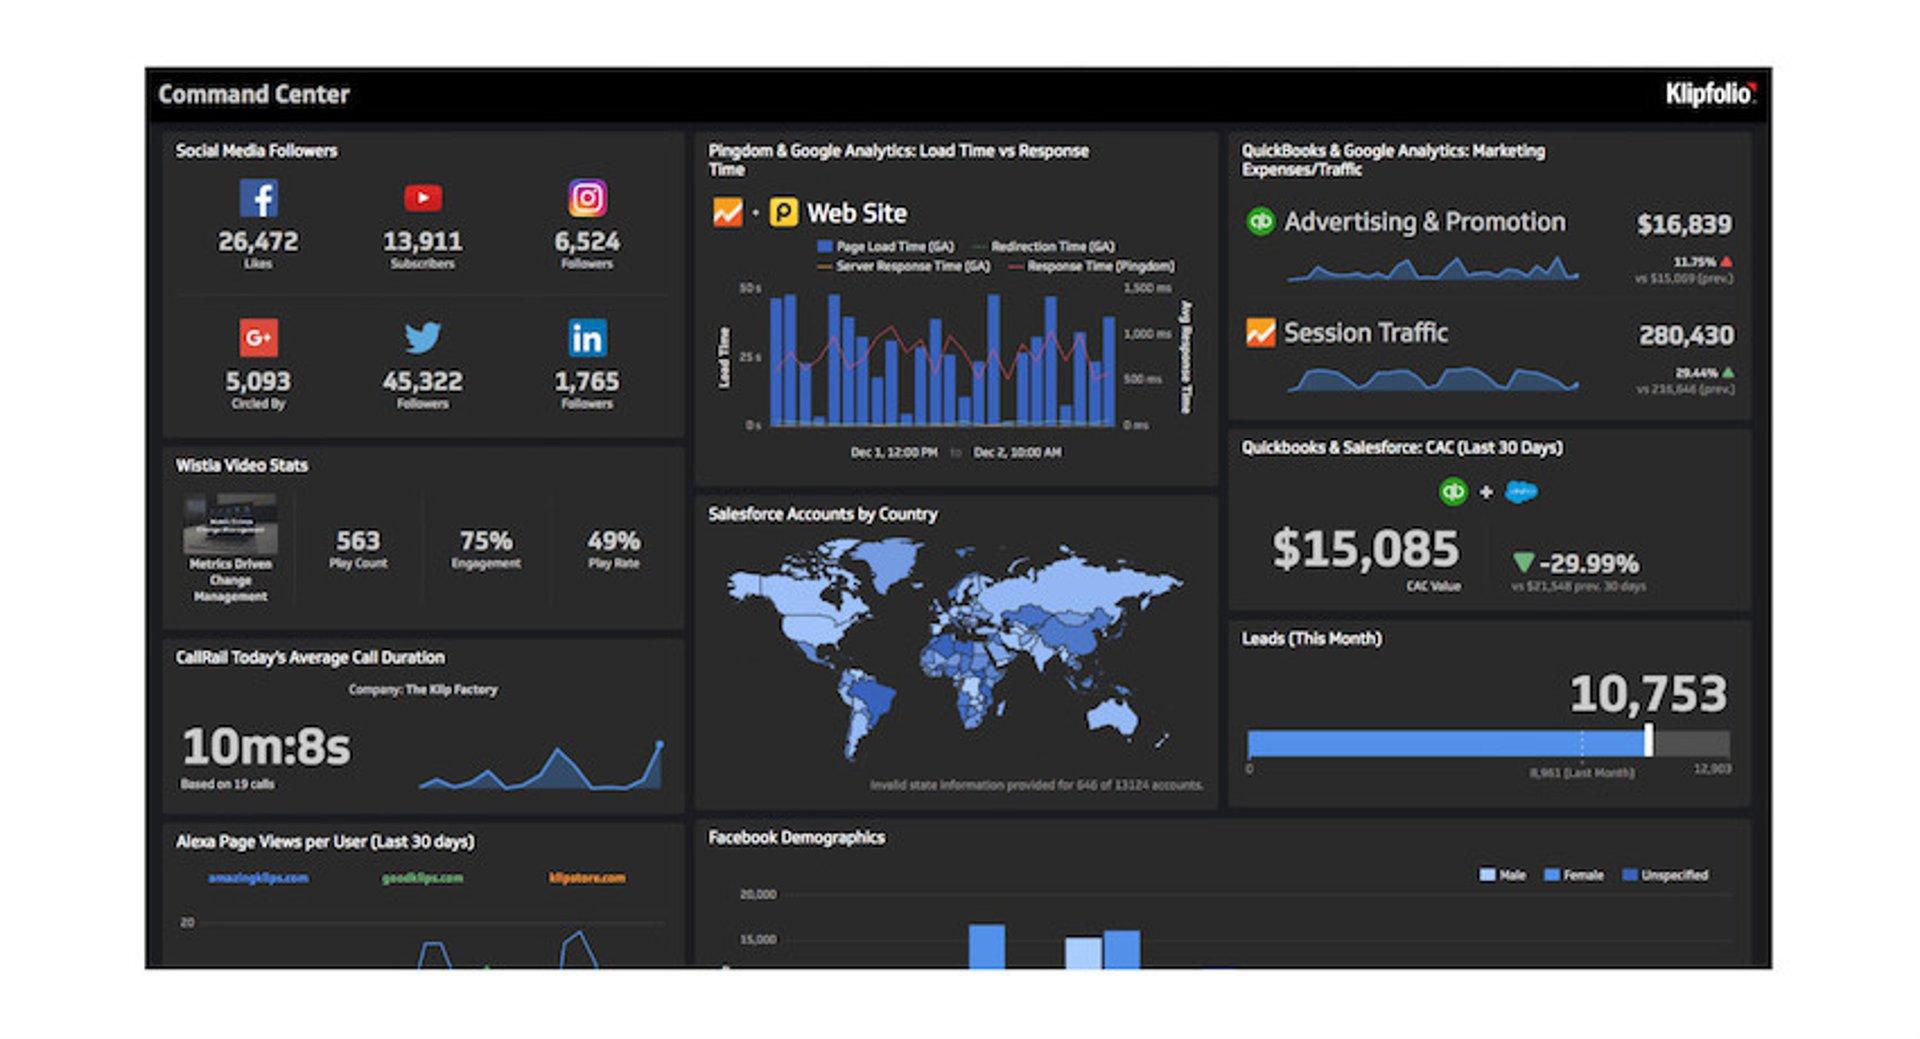
Understanding Key Metrics for Growth and Engagement
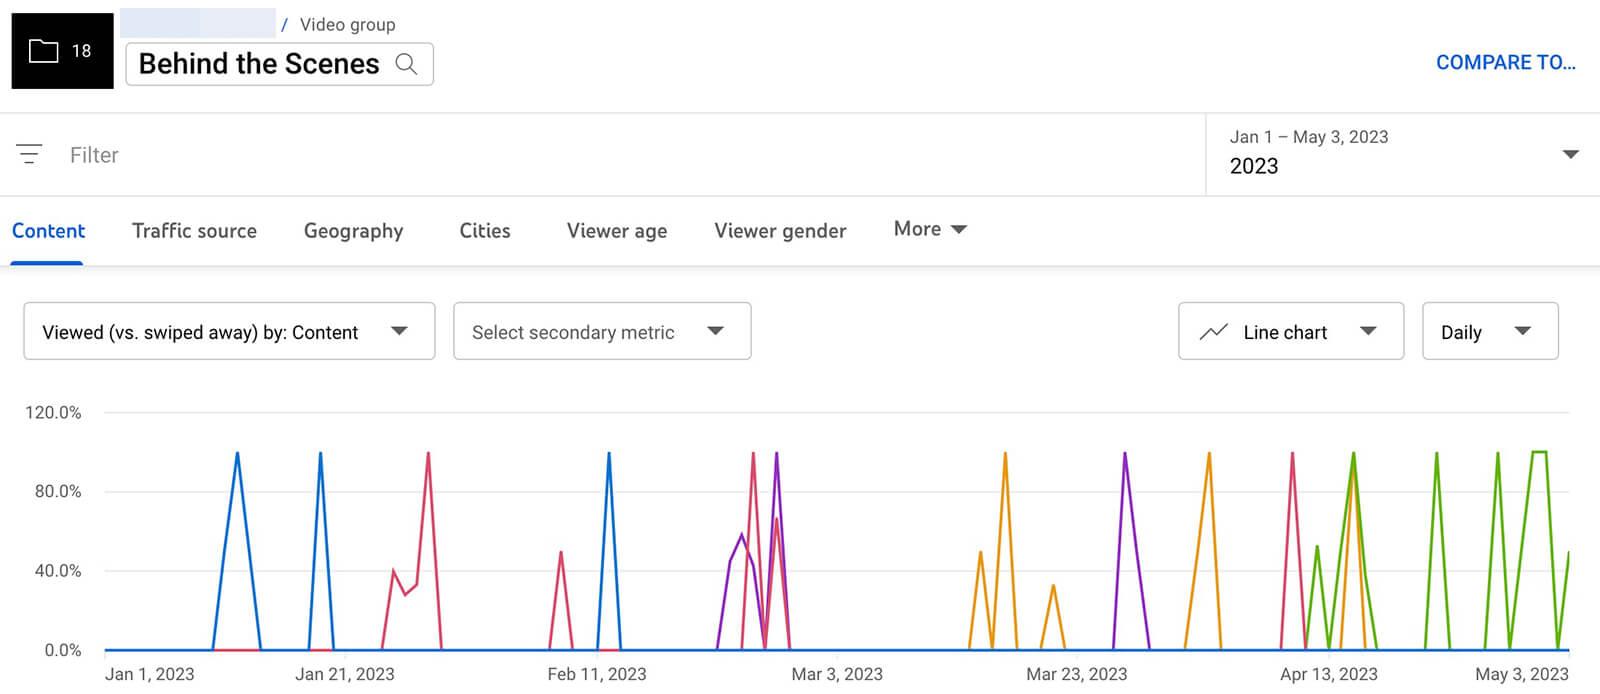
As an influencer, diving into your YouTube Analytics can seem overwhelming, but understanding specific metrics will provide invaluable insights into your audience’s behavior and preferences.Key indicators such as Watch Time, Audience Retention, and Engagement Rate can help you fine-tune your content strategy. For instance, watch time measures the total minutes your audience spends watching your videos, which directly influences your content’s visibility on the platform. A higher audience retention rate indicates that viewers find your content engaging enough to stick around until the end, which is critical for improving future videos.
Moreover, analyzing your Click-Through Rate (CTR) and Traffic Sources can provide a clearer picture of how effectively your thumbnails and titles capture audience interest.By examining the following metrics,you can identify areas for improvement:
- CTR: Helps assess the appeal of your video’s title and thumbnail.
- Traffic Sources: Shows where your viewers are coming from, highlighting the success of your promotional efforts.
- Comments & Likes: Indicate viewer engagement and satisfaction.
| Metric | Significance |
|---|---|
| Watch Time | Measures viewer engagement; affects visibility. |
| Audience Retention | Tracks how long viewers stay; higher retention = better content. |
| Engagement Rate | Indicates how compelling your content is to viewers. |
Navigating Audience Demographics to Target Your Content
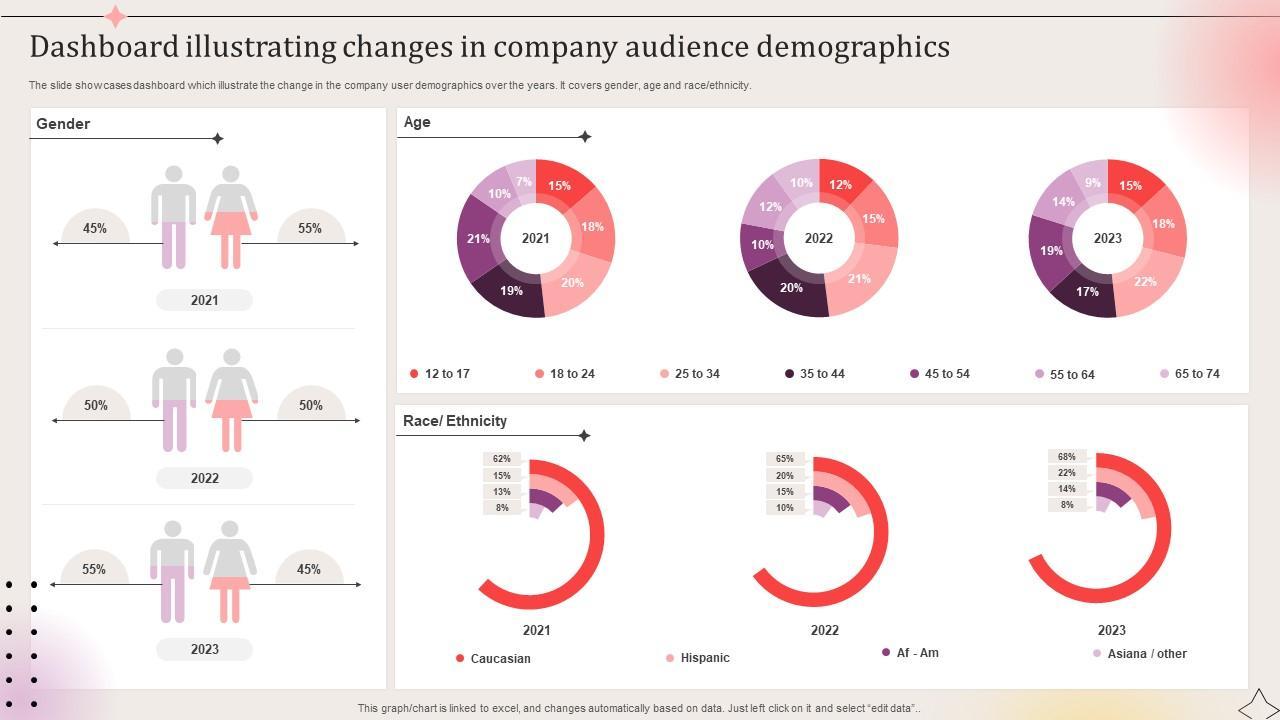
Understanding your audience is the key to creating engaging content that resonates with viewers.By diving into YouTube Analytics, you can uncover essential insights about who is watching your videos. Key demographic metrics include:
- Age Range: Tailor your content to appeal specifically to the age groups that represent the largest segments of your audience.
- Gender Distribution: Analyzing the gender of your viewers can definately help inform the tone and style of your content.
- Geographic Location: Knowing where your audience is located allows you to incorporate local trends or references that make your content more relatable.
Furthermore, examining viewer engagement metrics can provide additional layers of understanding. Assessing factors such as:
- Watch Time: Focus on the types of content that keep viewers engaged longer.
- Traffic Sources: Identify how viewers find your videos—whether through search, suggested videos, or external sources—and tailor your promotion strategies accordingly.
- Audience Retention: Analyze at which points viewers drop off to enhance content for better viewer retention in future videos.

Optimizing Video Performance through A/B Testing Strategies
To maximize the impact of your videos, employing A/B testing can uncover insights that are often overlooked in the analytics. Begin by experimenting with various elements of your videos, such as thumbnails, titles, and calls-to-action. For instance, you might consider A/B testing two different thumbnails to see which garners more clicks.review the results to identify patterns and preferences within your target audience. This data-driven approach allows creators to shift their strategies in alignment with audience behaviors, ensuring content remains engaging and relevant.
Additionally, consider testing the length and structure of your videos. Start with a hypothesis: shorter videos may retain viewers better than longer ones. Release multiple versions of a video with varying lengths and track performance metrics such as watch time, click-through rate, and engagement. Utilize a table to summarize your findings:
| Video Length | watch Time (min) | Engagement Rate (%) |
|---|---|---|
| 3 minutes | 2.5 | 65 |
| 5 minutes | 3.8 | 70 |
| 10 minutes | 5.2 | 55 |
By analyzing these metrics, you’ll gain valuable insights into how varying content structures can influence viewer retention and interaction. Integrating A/B testing into your content creation process not only enhances performance but cultivates a deeper understanding of your audience’s preferences.

Leveraging Insights for Strategic Content Planning
Understanding your audience is crucial for creating content that resonates. By diving deep into YouTube Analytics, you can uncover valuable insights that will shape your content planning strategies. Look for patterns in your viewer demographics, such as age, gender, and geographic location. This information can help you tailor your upcoming videos to meet the preferences and expectations of your target audience.Additionally, keep an eye on engagement metrics like watch time, likes, and comments to identify which types of content provoke the most interaction. These insights will empower you to create content that not only attracts viewers but also retains their interest.
Another powerful feature of YouTube Analytics is the traffic source analysis, which reveals where your viewers are coming from. Utilize this data to focus your promotional efforts more effectively. For instance, if the majority of your views stem from social media platforms, consider enhancing your cross-channel engagement by promoting your video content more vigorously on those platforms. Further, you can implement A/B testing for thumbnails and titles to see which variants perform better, ultimately enhancing your click-through rates.Below is a simple table showcasing the potential traffic sources and their impact on audience engagement:
| Traffic Source | Viewer Engagement Impact |
|---|---|
| Direct Traffic | High |
| Social Media | Medium |
| Search Engines | High |
| Suggested Videos | Very High |
In Retrospect
As we journey through the intricate landscape of YouTube Analytics,we uncover a treasure trove of insights that can propel influencers toward success. By understanding the nuances of viewer engagement, demographic trends, and content performance, creators are empowered to tailor their strategies, foster deeper connections with their audience, and ultimately elevate their presence in the crowded digital arena. The path to influence is paved with data-driven decisions and informed creativity, ensuring that every video resonates with its intended audience. As you navigate your own YouTube journey, remember that these analytics are not just numbers; they are reflections of potential, guiding you toward authenticity and growth. Embrace the insights, adapt your approach, and watch as your influence flourishes in this vibrant online ecosystem. Happy creating!