In the ever-evolving landscape of digital marketing, few platforms have wielded the power and influence of YouTube, a vibrant ecosystem were creativity and commerce intersect. As brands turn to influencers to amplify their messages,understanding the intricacies of YouTube Analytics becomes imperative. But what lies beneath the surface of those seemingly cryptic numbers and graphs? “Decoding YouTube Analytics: Unlocking Influencer Marketing Insights” invites you on a journey through the metrics that matter—the keywords that drive traffic, the audience demographics that shape campaigns, and the engagement rates that reveal what resonates. join us as we demystify the data,empowering marketers and content creators alike to strategically harness YouTube’s potential and navigate the dynamic world of influencer marketing with confidence.
Understanding Your Audience Through Demographics and Behavior
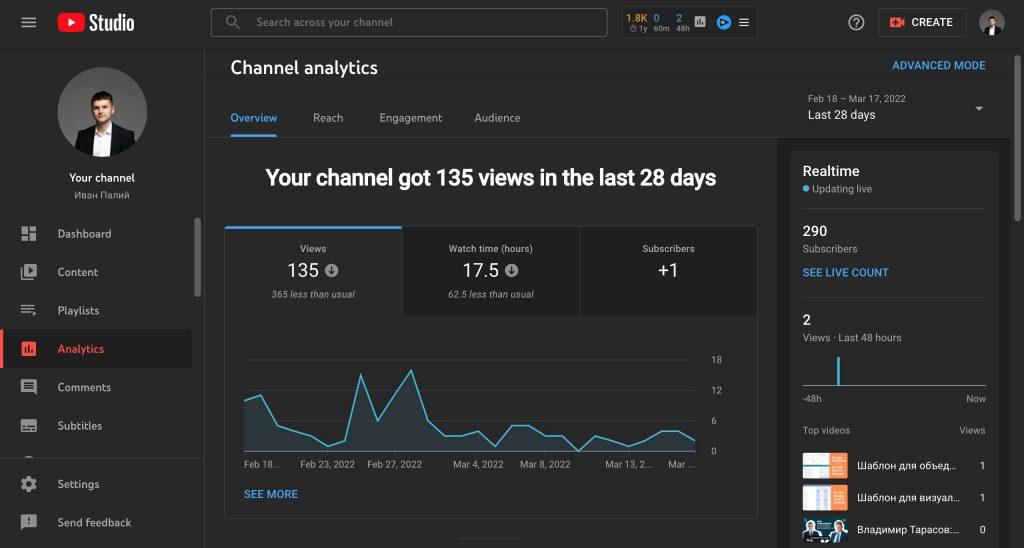
To effectively engage with your audience on YouTube,it’s essential to analyze both demographic and behavioral data. Demographics provide valuable insights into who your audience is, including aspects like age, gender, location, and language preferences. By understanding these characteristics, influencers can tailor their content to resonate with specific groups, enhancing viewer connection and engagement. For instance, if analytics show that a notable portion of your audience is between the ages of 18 and 24, it may be beneficial to create content that addresses trends and issues relevant to that age group.
Behavioral data takes this understanding a step further by revealing how your audience interacts with your content. Metrics such as watch time, engagement rates, and viewer habits help identify what captivates your viewers.Consider the following key behavioral indicators:
- Watch Time: The total amount of time viewers spend watching your videos.
- Click-through Rate (CTR): The percentage of viewers who click on your video after seeing the thumbnail.
- Audience Retention: How long viewers stay engaged before switching to another video.
by analyzing these behaviors, you can refine your content strategy, ensuring that you not only reach your target demographic but also keep them returning for more.
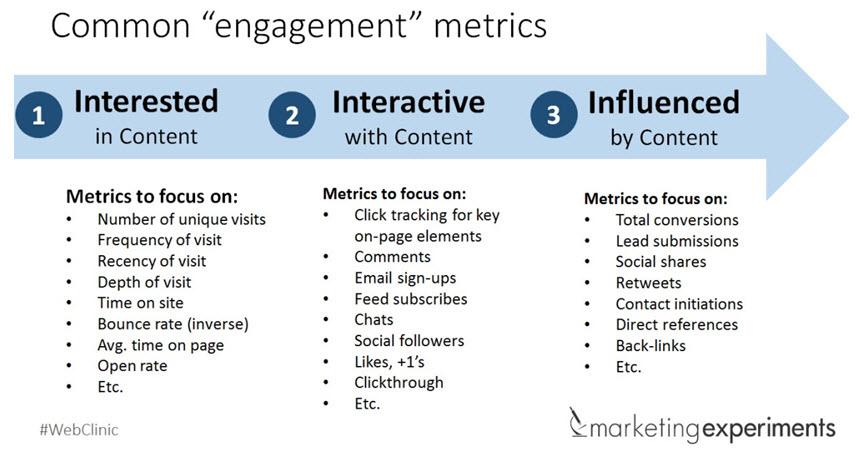
Interpreting Engagement Metrics for Targeted Content Strategy
Engagement metrics serve as a compass for navigating your content strategy on YouTube. By analyzing viewer interactions, such as likes, comments, shares, and watch time, you can uncover valuable insights into what resonates with your audience. As a notable example, a high number of comments may indicate that the content sparked discussion, revealing topics your viewers are passionate about. Not only does this foster a deeper connection with your audience, but it also informs future content creation that is aligned with their preferences. Identifying trends in these metrics over time can unveil patterns that help refine your content strategy.
Consider segmenting your audience based on engagement levels to tailor specific content for diverse viewer groups. This can include developing niche content aimed at highly engaged viewers or creating broader topics that appeal to a wider audience segment. Use the following metrics to segment your audience effectively:
- Watch time: Identify videos with prolonged viewer retention.
- Likes vs. Dislikes: Gauge general sentiment towards certain content themes.
- Share Rates: Determine what content is compelling enough for viewers to share.
- Comments Sentiment: Analyze the tone of viewer comments to assess emotional engagement.
To illustrate engagement metrics,consider the following summary table that showcases average interactions across different content types:
| Content Type | Average Likes | Average Comments | Average Shares |
|---|---|---|---|
| Tutorial Videos | 150 | 30 | 25 |
| Product Reviews | 200 | 45 | 35 |
| Vlogs | 120 | 20 | 15 |
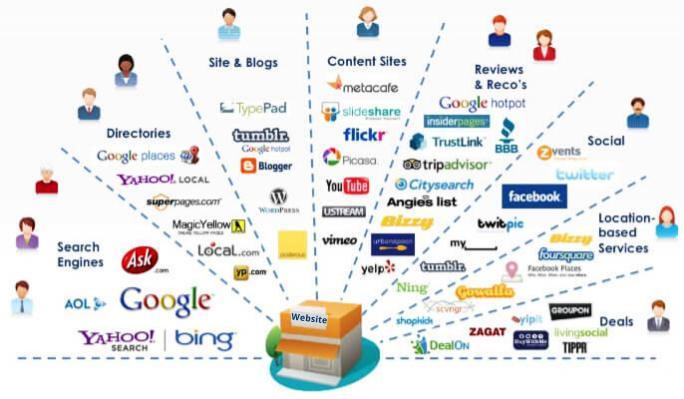
Leveraging Traffic Sources to Enhance Video Visibility
In the dynamic realm of YouTube, understanding how to harness various traffic sources is key to boosting your video’s reach and visibility. By identifying which sources direct viewers to your content, you can tailor your strategies more effectively. Common traffic sources include:
- Suggested Videos: Appearing next to other videos boosts potential views.
- search Results: Optimization for search engines ensures your video surfaces when relevant queries are made.
- External Sources: Cross-promoting on social media platforms, blogs, or websites can direct traffic to your channel.
- Playlists: Including your video in well-structured playlists encourages binge-watching and longer view durations.
By analyzing these traffic sources in your youtube Analytics, you can pinpoint which channels are performing best. Additionally, leveraging external links can considerably enhance visibility.Consider a simple strategy table to track and optimize these sources:
| Traffic Source | Engagement Rate | Actions |
|---|---|---|
| Suggested Videos | 45% | Enhance thumbnails |
| Search Results | 30% | Keyword Optimization |
| External Sources | 20% | Promote on Social Media |
| Playlists | 25% | Create Thematic Playlists |
This structured approach not only helps in monitoring performance but also encourages adjustments that can lead to improved viewer retention and interaction.A thorough understanding of these elements will empower you to cultivate a more engaged audience and amplify your influencer marketing efforts on YouTube.
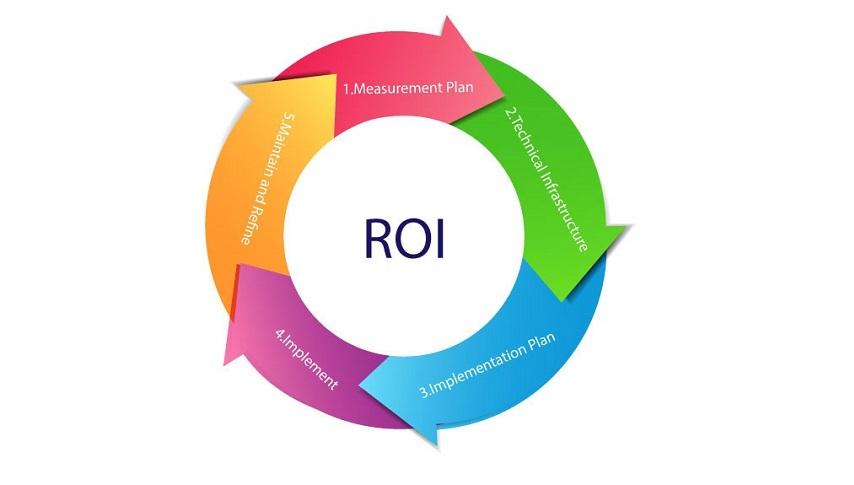
Measuring ROI: Converting Analytics into Influencer Marketing Success
Understanding the return on investment (ROI) of your influencer marketing campaigns requires diving deep into YouTube Analytics. By meticulously analyzing key metrics, brands can identify which collaborations yield the best results. To measure success effectively, consider focusing on the following areas:
- Engagement Rate: High engagement (likes, comments, shares) indicates active viewer interest.
- View Count: Greater views often correlate with higher brand visibility.
- Audience Demographics: Ensure your influencer’s audience aligns with your target market.
Furthermore, leveraging a data-driven approach can transform insights into actionable strategies. Create a comparison table that highlights various influencers’ performance metrics to identify trends and benchmark success:
| Influencer | Engagement Rate | Average Views | Follower Growth |
|---|---|---|---|
| Influencer A | 5.2% | 150,000 | 1,200/month |
| Influencer B | 3.8% | 80,000 | 800/month |
| Influencer C | 4.5% | 120,000 | 1,500/month |
Using these data points, brands can assess which influencers not only reach their audience but also engage them meaningfully, ultimately guiding investment decisions that maximize ROI and drive marketing success.
In Conclusion
As we draw the curtain on our exploration of YouTube Analytics and its profound implications for influencer marketing, it becomes clear that understanding these metrics is not merely about tracking numbers; it’s about unlocking a treasure trove of insights that can drive effective strategies and meaningful connections with audiences.
In the vast sea of content creators and viewers, data offers a guiding compass, illuminating the paths that resonate most with your target demographic. By dissecting engagement rates, traffic sources, and viewer behaviors, brands can tailor their approach, fostering authentic partnerships that stand out in the crowded digital landscape.
As you embark on your journey through YouTube’s analytical universe, remember that each view, like, and share tells a story—one that can enhance your marketing efforts and amplify your brand’s voice. Embrace the numbers,heed the trends,and let the insights gleaned from YouTube Analytics be your beacon in the ever-evolving realm of influencer marketing. With the right tools and knowledge at your disposal, the possibilities are limitless. Happy analyzing!