
In teh vast landscape of digital content, YouTube stands as a towering giant, fostering creativity and connection among millions. For influencers navigating this vibrant platform, understanding audience engagement and content performance is crucial to success. Enter YouTube Analytics—a powerful toolkit that transforms raw data into valuable insights. But what lies behind the dashboard? As influencers seek to refine thier craft and amplify their impact, unlocking the secrets of YouTube Analytics can be the key to unlocking their potential. In this guide, we will delve into the nuances of YouTube Analytics, exploring how to interpret its metrics, harness strategic insights, and ultimately cultivate a more resonant presence in the ever-evolving world of online video. join us on this journey as we decode the language of analytics and empower your influence on one of the globe’s most dynamic platforms.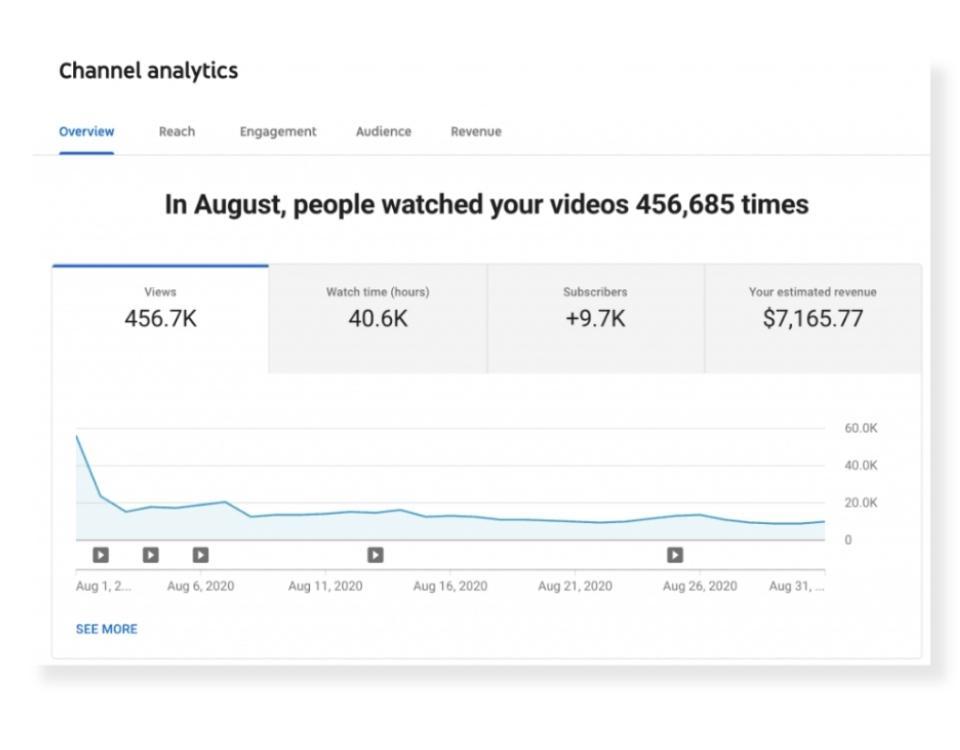
Understanding youtube Analytics: Navigating the Dashboard for Valuable Data
Navigating the YouTube Analytics dashboard can feel overwhelming, but understanding the key metrics will empower you to make data-driven decisions. Start by familiarizing yourself with the Overview tab, where you’ll find essential performance metrics such as views, watch time, and subscribers gained. This snapshot not only highlights your channel’s success but also helps you spot trends over time. Use the various filtering options to zoom in on specific dates, video types, or even individual videos, allowing for a more nuanced understanding of your performance and audience behavior.
To dive deeper, explore the Reach and Engagement tabs, which reveal how viewers are discovering your content. Focus on metrics like impressions, click-thru rate (CTR), and average view duration to assess how well your thumbnails and titles perform. Additionally, gathering insights from the Audience tab can be immensely beneficial. You’ll discover demographics, geography, and when your audience is online, enabling you to tailor your content and upload schedules more effectively. Here’s a brief summary of essential metrics to monitor:
| Metric | Description |
|---|---|
| Views | Total number of times your video has been viewed. |
| Watch Time | Total minutes viewers have spent watching your content. |
| Subscribers Gained | Net increase in subscribers during a specific period. |
| Click-Through Rate | Percentage of impressions that turned into views. |

Decoding Audience Metrics: Insights into Viewer Engagement and demographics
Understanding viewer engagement metrics is crucial for influencers aspiring to elevate their YouTube channels. Through the YouTube Studio analytics dashboard, creators can access essential data points such as watch time, likes, comments, and shares. These metrics offer valuable insights into how well your content resonates with your audience. Examining average watch duration gives a clear indication of whether viewers are sticking around to absorb your message, while engagement rates illuminate the level of interaction your videos provoke. By monitoring these indicators consistently, influencers can refine their content strategies to harness more impactful storytelling that aligns with audience interests.
Demographic data not only highlights who is watching your videos but also allows for tailored content creation. Key demographics include age, gender, and geographic locations, which help to paint a fuller picture of your viewer base. Understanding the composition of your audience can lead to targeted content that engages specific segments more effectively. Below is an example table showcasing an imaginary channel’s demographic insights:
| Demographic | Percentage |
|---|---|
| 18-24 Years | 45% |
| 25-34 Years | 30% |
| Female | 60% |
| Male | 40% |
| North America | 50% |
This data reveals a youthful viewer demographic, heavily skewed towards a female audience from North America, implying content tailored towards the interests and concerns of these groups will likely enhance engagement. By leveraging such insights, influencers can curate their content not just to attract more viewers, but to create a loyal community that resonates deeply with their messaging.

Content Performance Analysis: Leveraging View Stats for Strategic Growth
Understanding the nuances of view statistics is crucial for influencers aiming to fine-tune their strategies and maximize their reach. By dissecting the data presented in YouTube Analytics, content creators can identify trends and patterns that lead to informed decision-making. Key metrics to focus on include:
- Watch Time: Signals audience engagement and encourages algorithmic promotion.
- audience Retention: Reveals where viewers lose interest, allowing for content adjustments.
- Traffic Sources: Indicates where views are coming from, helping refine marketing efforts.
To visualize the impact of strategic changes, consider using a table that compares performance metrics before and after implementing targeted strategies. this can provide clear insights into what works and what doesn’t.
| Metric | Before Strategy | After Strategy |
|---|---|---|
| Total views | 10,000 | 15,000 |
| Watch Time (hours) | 500 | 800 |
| Average view Duration | 2:30 | 3:15 |
By consistently monitoring these statistics and adjusting content accordingly, influencers can create a proactive approach to growth. Leveraging this data not only enhances the viewer experience but also solidifies the influencer’s place in the digital landscape, driving sustained success.

Adapting Strategies: Using Analytics to Shape Future Content Creation
to effectively shape your future content creation, leveraging analytics is essential for understanding your audience’s preferences and behaviors. By diving deep into YouTube Analytics,influencers can uncover valuable data that reveals what resonates with their viewers. This data includes metrics such as watch time, audience retention, and demographic information.By analyzing these insights, creators can pinpoint which topics engage their viewers most, allowing for targeted content that drives better performance. Here are some key metrics to focus on:
- Watch Time: Indicates how long viewers are watching your videos.
- Audience Retention: Shows you where viewers are dropping off in your videos.
- Demographics: Provides insights into the age, gender, and location of your audience.
Additionally, keeping track of trends can guide your long-term strategies. By incorporating data from several videos, you can create a comprehensive picture of what type of content will likely attract more viewers in the future. Consider setting up a simple tracking system to visualize the performance of your videos over time. The following table outlines suggested content themes and their corresponding audience engagement metrics:
| Content Theme | Average Watch Time (minutes) | Audience Retention Rate (%) |
|---|---|---|
| How-To Tutorials | 10 | 70 |
| Product Reviews | 8 | 65 |
| Vlogs | 9 | 60 |
In Summary
navigating the intricate landscape of YouTube Analytics is not just a path to understanding your content’s performance; it’s a gateway to unlocking the deeper insights that can fuel your growth as an influencer.By delving into metrics like watch time,audience demographics,and engagement rates,you can tailor your strategies to resonate more profoundly with your viewers.Whether you’re a budding creator or an established influencer, mastering these analytics equips you with the knowledge needed to make informed decisions, innovate your content, and ultimately thrive in the ever-evolving digital sphere. So, embrace the power of data, and let it guide your creative journey on YouTube.The insights you discover could be the catalyst for your next big breakthrough, propelling you toward a brighter, more engaging future on the platform.Happy analyzing!